

Kevin Lynch, Managing Director – Investments, Credit Union Investment Strategy Group of Oppenheimer & Co. Inc.
The yield you see may not be the yield you get
The Bloomberg Yield Table is a practical place to start — it is not necessarily the place to end.
This one has the potential to leave you feeling blindsided, and that’s what can make it so disappointing.
Many mortgage-backed securities with a very low coupon and low weighted average coupon can appear to perform acceptably — or even quite attractively — when you run a Bloomberg yield-to-maturity (YTM) analysis at Median Public Securities Association (PSA) prepayment speeds. These median (MED) speeds make up the Bloomberg default Yield Table. So, we purchase that bond and simply assume it is going to do its job throughout the holding period.
I am a firm believer that the Bloomberg MED Yield Table is a practical place to start, but it is not necessarily the place to end. Why? Because the Median PSA is a modeling assumption — not a forecast. The real-world yield at actual prepayment speeds can often vary widely from the Bloomberg-MED PSA. Always keep this in mind: the farther away from par you purchase a bond, the bigger the role prepayment speeds play in the outcome and return.
Why Prepayment Speed Is Essential for a Deep-Discount Bond
Before walking through the screens, it helps to understand the mechanics driving the problem.
When a bond is priced at a significant discount to par — such as any 1.50% coupon MBS in today’s rate environment — your total return has two components: the below-market coupon you collect along the way, and the pull-to-par accretion as principal is returned at 100 cents on the dollar. The faster the pool pays down, the sooner that accretion is realized, and the higher the realized return. The slower prepayments are, the longer your capital is tied up at that below-market coupon — and the more that accretion gets stretched across a longer holding period, compressing your realized return.
This is why the WAC — the weighted average coupon of the underlying mortgage loans — matters so much in today’s environment. For a pool originated in 2020 with a WAC around 2.50%, every borrower in that pool has a mortgage rate roughly 400 basis points below where new loans are being originated today. Their refinancing incentive is not low, it is effectively nonexistent. The only prepayments coming out of a pool like this are life events — job changes, relocations, defaults — not refinancing activity. That is a thin, slow, and largely unpredictable source of principal return.
Example 1: FNR 2020-94 CA
The three screens that tell three different stories
THE BOND
FNR 2020-94 CA, a Fannie REMIC backed by 100% FNCL 1.5s. 2020 vintage. 1.50% coupon. WAC of approximately 2.50%. Priced at $88-20 — a deep discount to par. Final maturity November 2044.
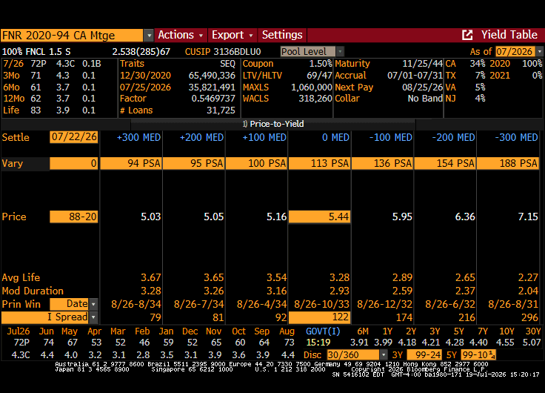
SCREEN 1: YT MED — WHAT THE DEFAULT YIELD TABLE SHOWS (JULY 19, 2026)
Source: Bloomberg
At the Bloomberg default MED Yield Table, the base case is 0 MED = 113 PSA, producing a yield of 5.44% and an average life of 3.28 years. Not bad. That is an attractive yield at what appears to be a relatively short average life. The worst-case column on the MED screen — +300 MED, where speeds slow to 94 PSA — shows a yield of 5.03% at an average life of just 3.67 years. Note: this pool is fully seasoned, so 100 PSA equals 6 CPR. That makes the MED base case of 113 PSA about 6.8 CPR, and the +300 worst case of 94 PSA about 5.6 CPR.
Still quite attractive. Nothing on this screen would cause most investment officers to pause.
This is exactly the problem.
The MED Yield Table is built on dealer consensus speed submissions — a median of what dealer models are projecting for this coupon and origination cohort across a range of rate environments. It is a reasonable broad-market estimate. It is not an estimate calibrated to the reality of a 1.50% coupon pool in a 6.00%+ mortgage rate environment. The current 0 MED screen projects a 113 PSA. The actual speed environment for this particular bond has been less than 75 every month over the last year, with the 12-month PSA coming in at 62 — roughly 3.7 CPR, against the 6.8 the default screen is assuming. Even at its most conservative +300 MED 94 PSA scenario, the table suggests a higher prepayment than anything observed over the last year.
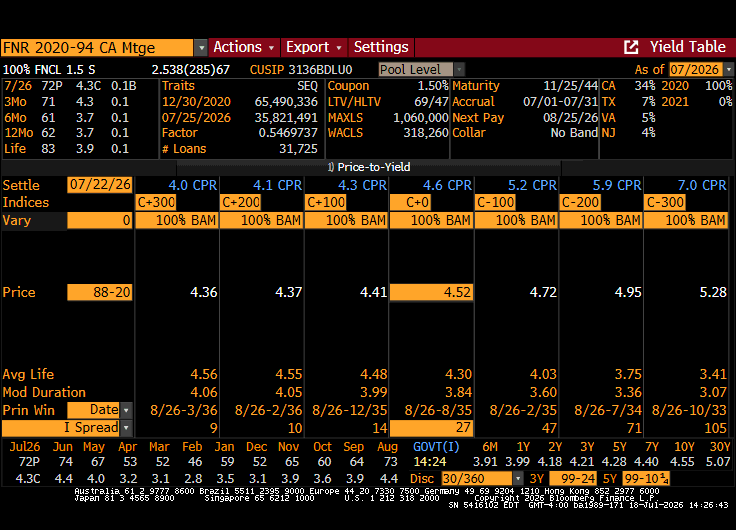
SCREEN 2: YT BAM — WHAT BLOOMBERG’S OWN MODEL SAYS
Switch the Yield Table from MED to Bloomberg’s Agency Model (BAM), its internally developed econometric prepayment model that explicitly incorporates current mortgage rates, WAC, loan age, geography, and refinancing incentive, and the picture changes materially.
Source: Bloomberg
BAM’s base case for this pool is 4.6 CPR. At that speed, the yield falls to 4.52% and average life extends to 4.30 years. That is a 92-basis point reduction in yield from the MED base case, with an average life more than a full year longer and modified duration extending to roughly 3.8. One caveat worth knowing: BAM projects a speed vector rather than a constant, so the CPR it displays is a summary of that path and won’t tie exactly to a flat CPR ramp at the same nominal speed.
BAM’s stress scenarios span 4.0 CPR at the slow end — a 4.36% yield at a 4.56-year average life — to 7.0 CPR at the fast end, yielding 5.28%. Not one column on the BAM screen reproduces the 5.44% yield the MED base case projected.
BAM is telling you, plainly, that the MED assumption is too generous for this collateral in this rate environment.
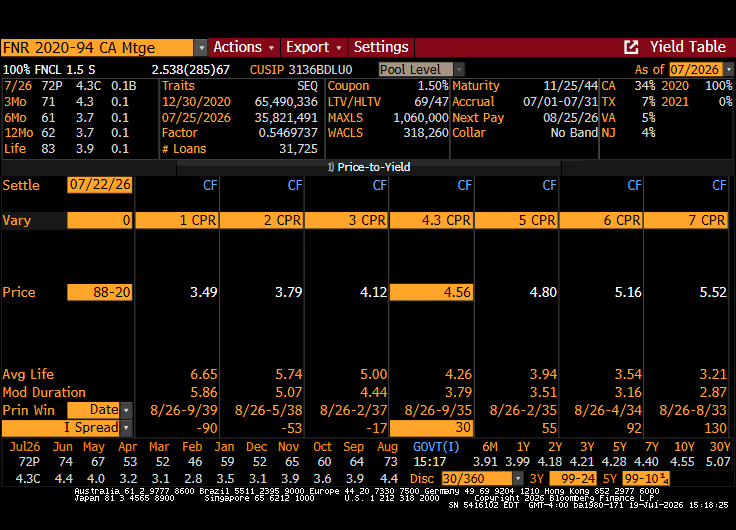
SCREEN 3: CPR RAMP — CENTERED AROUND THE ACTUAL PREPAYMENT SPEEDS
The CPR Ramp table removes model assumptions entirely and lets you set the prepayment speed manually, in constant annual terms, to see exactly what happens to yield and average life when ramping CPR up and down from the actual prepayment print. For this bond, the results are illuminating:
| CPR ASSUMPTION | YTM | AVG LIFE | MOD DURATION |
| 1 CPR | 3.49% | 6.65 yrs | 5.86 |
| 2 CPR | 3.79% | 5.74 yrs | 5.07 |
| 3 CPR | 4.12% | 5.00 yrs | 4.44 |
| 4.3 CPR (3mo print) | 4.56% | 4.26 yrs | 3.79 |
| 5 CPR | 4.80% | 3.94 yrs | 3.51 |
| 6 CPR | 5.16% | 3.54 yrs | 3.16 |
| 7 CPR | 5.52% | 3.21 yrs | 2.87 |
For illustrative purposes only. Source: Bloomberg.
Source: Bloomberg
For a 1.50% coupon pool with a WAC of approximately 2.50% in a 6.00%+ mortgage rate environment, a CPR in the 1–7 range is not a stress scenario in the traditional sense. It is closer to base case. Over the last year, this bond has paid at a low of 2.8 CPR to a high of 4.4 CPR. Furthermore, additional prepayment history shows a most recent print of 4.3 CPR, a 3-month at 4.3 CPR, a 6-month at 3.7 CPR, and a 12-month at 3.7 CPR. All of these speeds reflect collateral that has already slowed down significantly.
At 4.3 CPR — using the 3mo CPR which is often used when calculating accretion/amortization — the yield is 4.56% with an average life of 4.26 years. That is an 88-basis point reduction in yield from the MED base case, with an average life that is over one year longer. At 3 CPR, yield falls to 4.12% and average life reaches 5.00 years. The duration profile of the bond you thought you were buying can look materially different with just small changes to expected prepayment speeds. At 6 CPR, the bond is back over 5%. We just don’t know when we will see consistent speeds at that level again.
What the Three Screens Tell You Together
The MED Yield Table told you: 5.44% at 3.28 years. Attractive.
BAM told you: 4.52% at 4.30 years. 92 basis points lower. Over a full year added to the average life.
The CPR Ramp centered around the observed 3mo CPR of 4.3 told you: 4.56% at 4.26 years, 88 basis points below the MED base case with an average life a year longer.
Same bond. Same price. The two alternate yield tables tell a consistently different story than the Bloomberg MED. The YT BAM and a CPR Ramp are easy to produce within Bloomberg. Don’t hesitate to ask for one or both when deciding on a purchase.
This is not a minor analytical footnote. A 92-basis point yield reduction and a one-year increase in the average life is a meaningful change in both the income contribution and the interest rate risk profile of a position. It is the difference between a bond that earns its place in the portfolio and one that quietly underperforms expectations while the credit union waits for speeds that may not arrive for some time. If that YTM profile still fits the investment objective, now a decision is made with realistic expectations.
The Point Is Not to Avoid Low-Coupon MBS
While the MED PSA Yield Table shows a worst-case yield of 5.03% at the +300 MED scenario, the additional yield tables tell a meaningfully different story. The bond still has potential, particularly when you factor in the price appreciation available in a falling rate environment, where accelerated prepayments and spread tightening could both contribute to total return. There is a scenario where this bond performs well.
But we now know that our return can be significantly lower while we are waiting for faster speeds to show up — and we know approximately how much lower, and for how long, depending on where actual prepayments land.
The point here is not to avoid low-coupon MBS. The right bonds can add real value to a portfolio. It is to warn against over-reliance on one yield table. Choosing the right bond with a clear and realistic expectation for performance can greatly reduce a disappointing outcome in the short/intermediate term.
When the Next Low-Coupon MBS Offer Lands in Your Inbox
When conducting a pre-purchase review of any MBS offering with a low coupon at a steep discount, ask for the additional Yield Tables to get the complete story:
- YT BAM, at the very least. Bloomberg’s Agency Model, calibrated to the current rate environment and refinancing incentive. This should be your primary analytical reference for low-coupon, low-WAC collateral, not a secondary check.
- CPR Ramp, extra due diligence to broaden the evaluation. Review the bond at a CPR ramp that reflects the actual speed that the bond has exhibited recently. These are not stress scenarios. They are realistic scenarios that could give a better representation of actual return in the current yield environment. Start with the actual 3M CPR print and move faster and slower in small/modest increments.
- YTH (Historical PSA), optional. The yield table using the bond’s own observed prepayment history. For pools that have already been slowing, recent historical speeds may be even more informative than a model projection.
If the bond only looks attractive on the MED screen, and the BAM and slow CPR scenarios reveal a yield and average life that no longer justify the purchase, that is the information you needed before you bought it, not after.
The MED Yield Table is where the analysis starts. It is not where the decision should end.
Figures are drawn from Bloomberg analytics as of July 2026 on FNR 2020-94 CA (CUSIP 3136BDLU0). For illustrative and educational purposes only. This article does not constitute investment advice. Actual prepayment performance will vary.
START THE CONVERSATION
If you are interested in seeing how active management looks in relation to your credit union’s investment portfolio, submit your information below and a member of our small, 9-person team will contact you to schedule a discovery call and to answer any questions that you may have about the process, or contact Kevin Lynch, Managing Director — Investments, directly to schedule an introductory discussion. Request a discovery call
IMPORTANT DISCLOSURES
This report is not intended as a recommendation or an offer or solicitation for the purchase or sale of any security or investment advisory service. The investments discussed in this report may not be suitable for all institutions/investors, who should use the analysis provided by this report as one input into formulating an investment opinion and should consult with their Financial Advisor.
Oppenheimer & Co. Inc. (“Oppenheimer”) does not guarantee that the information in this report is accurate, complete or timely, nor does Oppenheimer make any warranties with regard to the materials or the results obtained from their use.
Nothing in this report constitutes legal, accounting or tax advice. As with any investment having potential tax implications, clients should consult with their own independent tax adviser.
Investments involve numerous risks including market risk, counterparty default risk and liquidity risk. Securities and other financial investments at times may be difficult to value or sell.
The yield and average consider prepayment assumptions that may or may not be met. Changes in payments may significantly affect yield and average life.
Investing in the bond market is subject to certain risks including market, interest-rate, issuer, credit, and inflation risk. Mortgage and asset-backed securities may be sensitive to changes in interest rates, subject to early repayment risk, and their value may fluctuate in response to the market’s perception of issuer creditworthiness; while generally supported by some form of government or private guarantee there is no assurance that private guarantors will meet their obligations. Non-rated bonds or bonds rated below investment grade are speculative in nature and may not be suitable for all investors.
Interest is subject to federal, state, and local taxes. A company’s financial health can change, and when it does, its bonds’ ratings may change as well. So an investment grade bond could become non-investment grade over time and vice versa.
The information is for illustrative purposes only and not a guarantee of future results and Oppenheimer makes no representation or warranty, express or implied, in respect of the securities, services or information mentioned in this report.
Oppenheimer & Co. Inc. Transacts Business on all Principal US Exchanges and is a Member of SIPC 8990308.1