

Mistakes Three, Four, and Five
There is no general ledger account for yield you didn’t earn.
Kevin Lynch, Managing Director – Investments, Credit Union Investment Strategy Group of Oppenheimer & Co. Inc.
In the first two articles of the series, we discussed active versus passive portfolio management, and the potential problem with buying low-coupon MBS off a single Bloomberg MED yield table. Each of those topics deserved to be addressed on their own.
The remaining three mistakes belong together, because they represent three different shades of the same issue, Foregone Income or Opportunity Cost:
- Carrying too much cash
- Staying too short — the 1 to 2-year ladder
- Over-reliance on new-issue AGCY callable bonds
What ties them together is not duration, or credit, or structure. It is that all three can cost real money, every single day, and none of that cost directly appears anywhere in your financials.
Hidden from View
A realized loss has a line item. It shows up on the income statement, it gets discussed during ALCO meetings, it may require an explanation to the board. Foregone income has none of that. It gets absorbed silently into an ROA that could/should be higher than what it is.
Interestingly, this problem is the inverse of the problem we described in the first article of this series. There, the obstacle was a visible cost — the potential realized loss that keeps a credit union from repositioning a portfolio it knows is underperforming. That realized loss sits where everybody can see it.
Here, the obstacle is an invisible cost. It is easy to underweight or ignore because nobody can see it.
Same cognitive error, running in opposite directions, and the second one is usually the more expensive of the two. The portfolio decisions that feel safest are precisely the ones whose costs are never measured.
So, let’s measure them.
Mistake Three: Carrying Too Much Cash
Just about every credit union remembers what it felt like to be short on liquidity sometime after mid-2022 to 2024. The Fed started a new tightening cycle in March 2022. As the FED continued to aggressively raise rates in response to spiking inflation, loan demand started to heat up. As lending continued, the large cash position from 2020-2021 started to dwindle. The competition for members’ deposits became fierce. Certificate rates rose higher and higher as all financial institutions scrambled for liquidity. Eventually, many credit unions found themselves using alternative sources for liquidity… borrowing. The industry was effectively forced out of its comfort zone. While I am a believer that our best growth happens outside of our comfort zones, the experience did leave a lasting mark. I often refer to this as Liquidity PTSD. Now, I see many instances of credit unions maintaining an oversized cash position in the hopes of staying well in front of the next big liquidity crunch.
That is an understandable reaction. It is also an expensive one.
Let’s use the $100MM-$250MM asset peer-group (Callahan’s Peer-to-Peer) to give us some cash position parameters. The weighted average cash to assets for this group is 10.13% as of Q2 2026. For a $200MM credit union, that is a little over $20MM held in cash. If a reasonable target is closer to 7% (the bottom Quartile is 5.9%), or $14MM, that equates to over $6MM in excess liquidity.
If we take it a step further, the Top Quartile of the peer group is holding 12.73% of their assets in cash, or $25.460MM. This equates to a whopping $11.46MM in excess liquidity sitting in an O/N account.
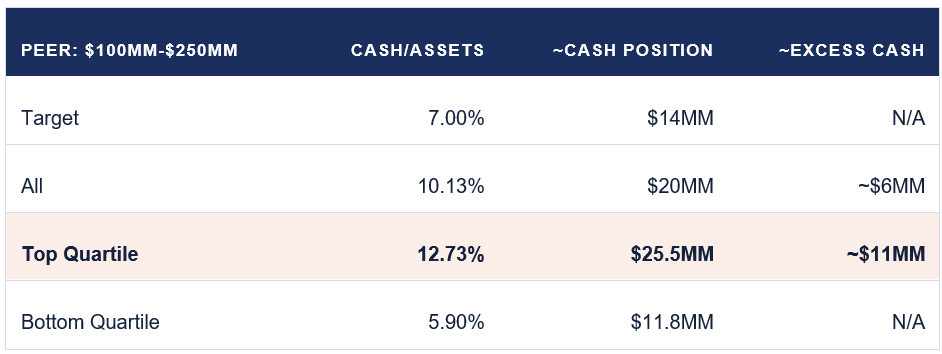
Source: Callahan’s Peer-to-Peer, Q2 2026. For illustrative purposes only.
How much are we earning on that cash? We looked at three corporate credit union’s overnight rates and came up with an average rate balance of 3.40% on a $25MM balance.
Foregone Yield / Income
Now, let’s compare the 3.40% rate to some other example investment alternatives that can be found in credit union portfolios:
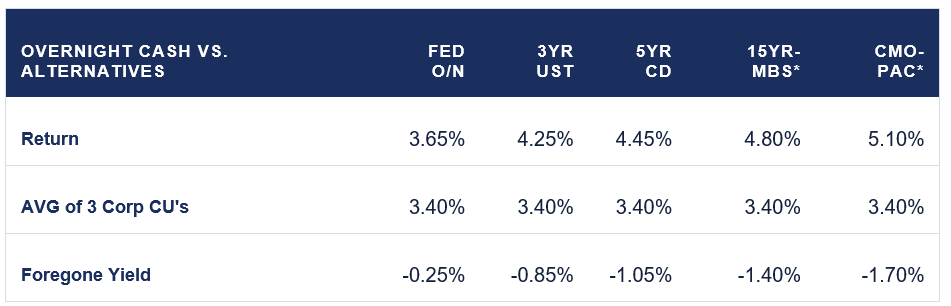
For illustration purposes only. Note: YTM on MBS & CMO at Bloomberg MED | Current Market YTM examples from 08-25-2026.
So, if we just stick with the 3YR UST alternative, there is an opportunity to pick up ~85 basis points over the current O/N rate of 3.40%. If we look at some of the other investment alternative examples, the potential spread pickup over overnight cash can range from 100 to 170 basis points. So, the cost of ‘parking money’ overnight instead of putting it to work can be expensive.
Let’s Take a Look at How Expensive
It’s one thing to talk about ‘basis points’ and spread. Now it’s time to see what that means in $’s. Using our $25MM cash example, and our excess cash levels of ~$11.46MM… Let’s just use $11MM:
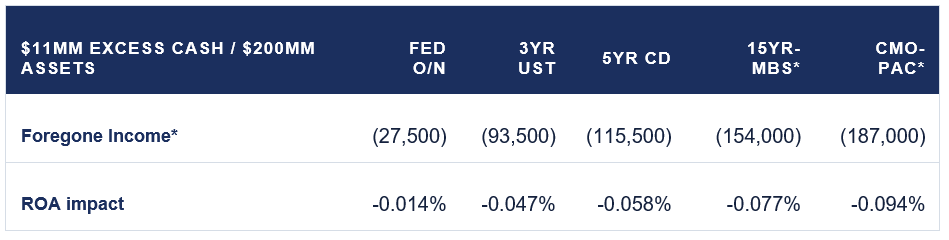
Annualized. For illustration purposes only.
This is the eye-opener… the potential earnings on $11MM that is being ‘left on the table (foregone) ranges from $93,500 to $187,000 (on an annual basis) using our investment examples. For a $200 million credit union that equates to 4.7 to 9.4 basis points of missed ROA. Not from a bad trade. Not from a credit event. From money sitting idle.
Mistake Four: Staying Too Short
This can be in addition to or a substitute for Too Much Cash. The classic version is a 12-24 month ladder built out of ~$250,000 insured CD blocks and/or $250,000+ blocks of Agency bullets, US Treasuries, or a combo. There are bullet-alternative strategies, but that is a conversation for another day. The short ladder is simple, it’s easy to explain to an ALCO or Board, and it provides the comfort of the certainty of principal return.
Let’s be fair about this one, because it is not quite the same as sitting in cash. With the one-year Treasury at 3.98% and the two-year at 4.19%, a two-year CD ladder blends out around 4.09%. Compare to the average overnight rate of 3.40%, that ladder is picking up 69 basis points. On $11 million, that is $75,900 a year of investment income that a credit union holding excess cash is not earning.
So, the ladder is doing work… Check ✓
The problem is what it costs relative to the alternatives we discussed in the prior section, and — more importantly — what it commits you to as far as portfolio repricing.
The Give-Up
The short 2-YR ladder makes up some ground versus the excessive cash position, but there is still a significant exposure to foregone income:
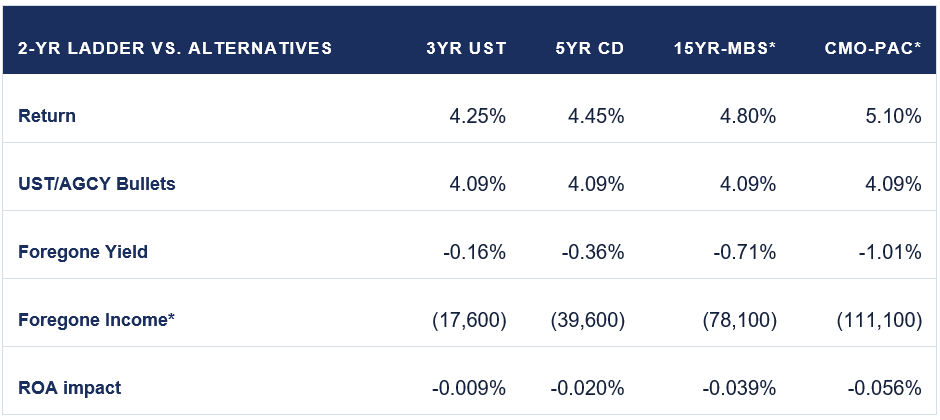
$11MM excess cash / $200MM assets. *Annualized. For illustration purposes only.
While reduced, foregone income is still ranging from $17,600 to $111,100 on an annual basis. Still significant. That is the income issue.
Here is the structural issue, and it is the one that can be overlooked. Fifty percent of a two-year ladder reprices every twelve months. Whatever the market offers over those twelve months is what you get. If yields are moving lower — you will reinvest lower. Conversely, if yields are higher, you will re-invest higher. This resembles an interest-rate bet whether it is done inadvertently or not.
Reinvestment risk is the risk that maturities and/or cash flow occur in a lower yield environment. Those funds are then reinvested in lower yielding bonds.
Keep in mind, the spread provided by the investment alternatives is not free money. It is compensation for extension and prepayment uncertainty, and anyone who tells you otherwise is selling something. The honest question is not whether the spread is free — it isn’t — but whether you are being adequately paid for the risk, and whether your credit union has ever actually priced it. Most haven’t. The ladder wasn’t chosen over structured cash flow after an analysis. It was chosen because it required no analysis.
Mistake Five: The New-Issue Agency Callable
New-issue AGCY Callables are pretty easy to buy. They are issued daily, priced at par, and the coupons are typically higher than what we can find in the bullet ‘space’… including many insured CD’s. The ease of the transaction and the higher coupons can lead to an over-allocation of New-Issue AGCY Callables in CU portfolios. Is it okay to add a callable here and there? Sure… in moderation, and in context to the overall composition of the portfolio. Ask yourself two questions… Am I okay if this bond gets called early? Am I okay if this bond never gets called?
The issue is the optionality. We have all heard of optionality, but what does it really mean for the investor? You are not in control of your own destiny when it comes to these bonds… the issuer is. Unfortunately, your goal as the investor is in direct conflict with the goal of the issuer. The investor is looking to maximize the return in the portfolio. The issuer is looking for the cheapest funding possible. When yields move modestly lower, the issuer has the opportunity to call your bond, and re-issue another one at a lower coupon. The investor gets the money back earlier than expected in a lower yield environment. Many times, the investor opts to just replace the called bond with another New-issue Callable. In a down yield environment, this can turn into a rinse-repeat situation. We call this the Callable Bond Trap.
The Callable Bond Trap in Theory
Pull up a chart of the five-year Treasury from 2017 forward and mark every point where a callable would have been taken out.
Every time yields decline, the issuer exercises the call option and you reinvest at a lower coupon. Yields keep falling, and the cycle repeats. Eventually you find the bottom — and you find it fully invested at the lowest coupons of the cycle. Then yields start to rise, and nothing gets called at all. You are stuck. In the meantime, that bond provides no cash flow other than a coupon payment twice a year.
A portfolio built on new-issue callables participates fully in every decline, but not a rising rate environment. When you don’t want them to call your bond, they call it. When you do want them to call your bond, silence.
You get the whole downside of the rate cycle and none of the upside, by design. Over a full cycle, realized yield drifts toward the bottom of the range rather than the middle.
The Callable Bond Trap in Practice
Let’s follow a single callable bond through its journey.
On June 14, 2024, the Federal Home Loan Bank issued a 5NC3MO Bermudan (quarterly) call at 5.80%, maturing June 27, 2029. Against the bullet alternatives available that day, the coupon looked excellent. Par purchase, five-year final not callable for 3-months. A fairly easy decision to make.
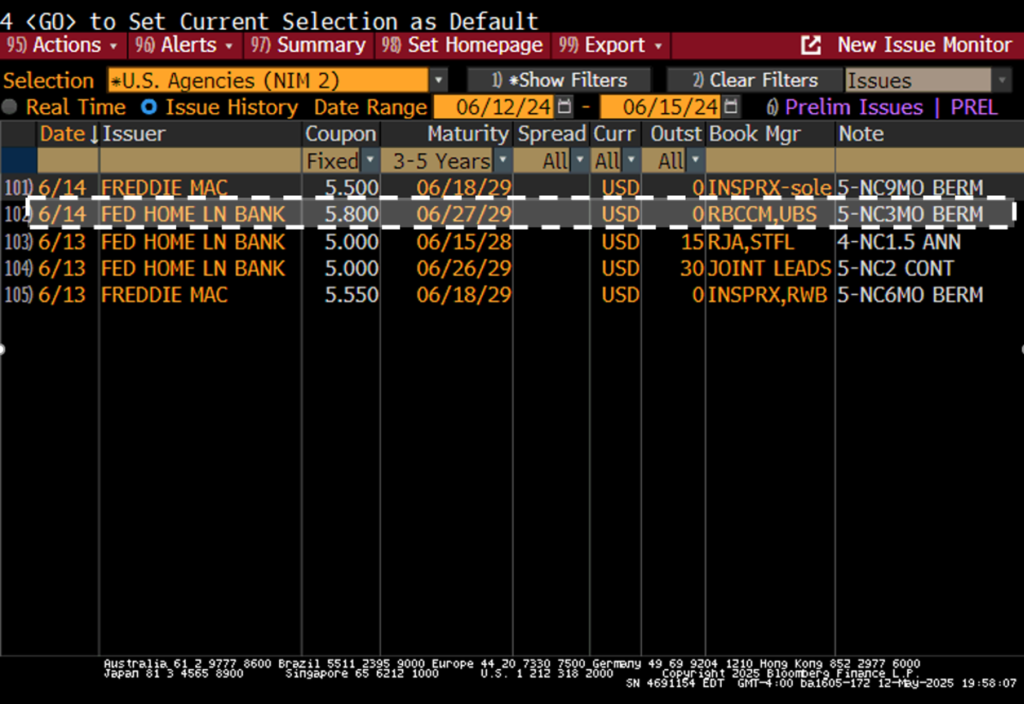
For illustrative purposes only | Source: Bloomberg
Unfortunately, the five-year US Treasury yield moved lower over the next half-year.
The bond was called on September 27, 2024 — on the first call date – three months after purchase.
We get all our money back 4.75 years before maturity.
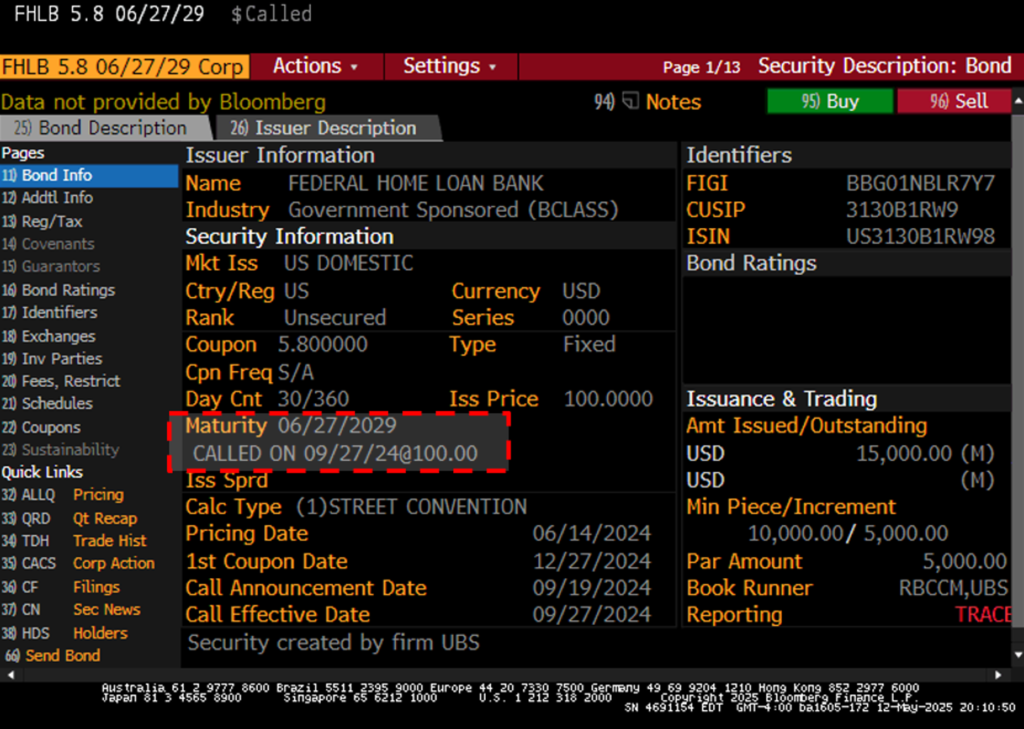
For illustrative purposes only | Source: Bloomberg
On the same day, Freddie Mac issued a new 5NC6MO QRTLY Call at 4.02%.
So, to replace the investment with a similar structure, we must accept a coupon that is 178 basis points lower.
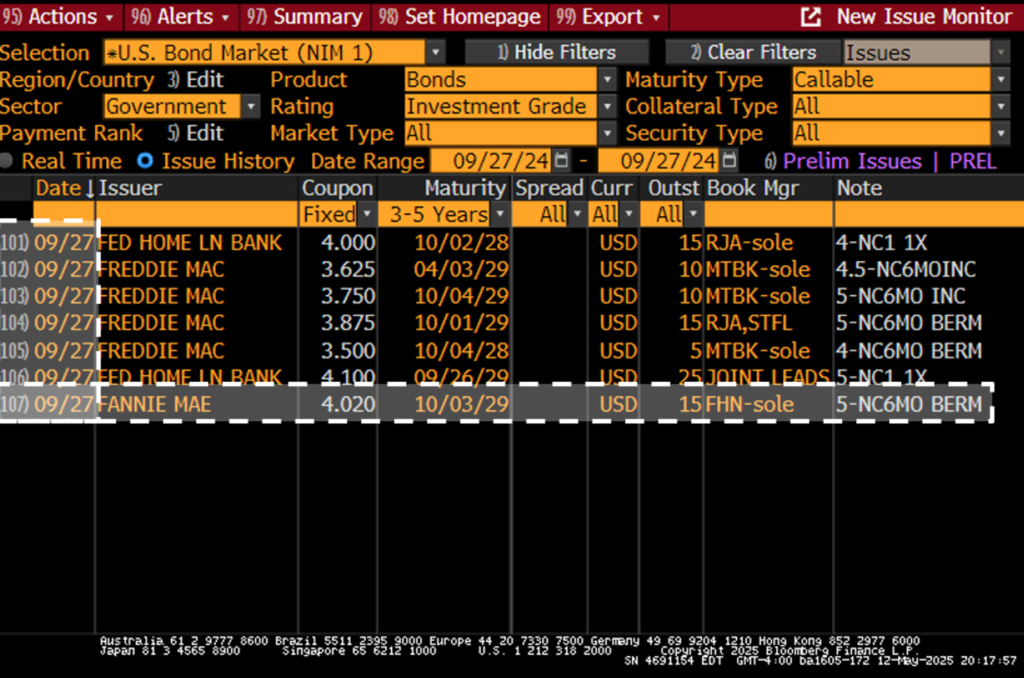
For illustrative purposes only | Source: Bloomberg
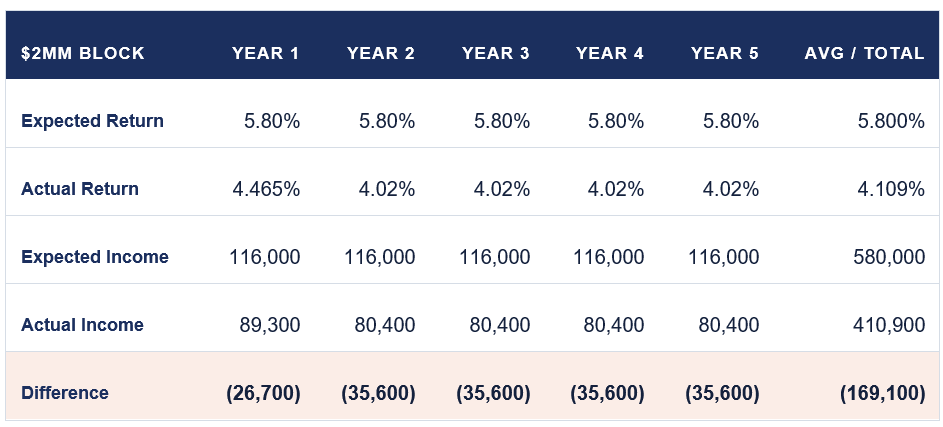
If we compare the expected outcome versus actual outcome, we can see the impact in basis points and interest income.
Year 1: 4.465% – Three months at 5.80%, then nine months at 4.02%
Year 2-5: 4.02%
Blended for 5 Years = 4.109% | (0.25 × 5.80%) + (4.75 × 4.02%) ÷ 5 = 4.109%
Note: The 4.02% cannot go higher, but it can go lower if the new callable is called before maturity.
The Impact on a $2MM Block
• 5-Year Return: Expected = 5.80% | Actual = 4.109%
• 5-Year Income: Expected = $580,000 | Actual = $410,900
For illustrative purposes only.
So, the call and reinvest resulted in a difference of $169K in expected income over ~5 years… that’s IF the 4.02% callable makes it to maturity.
Salt in the Wound?
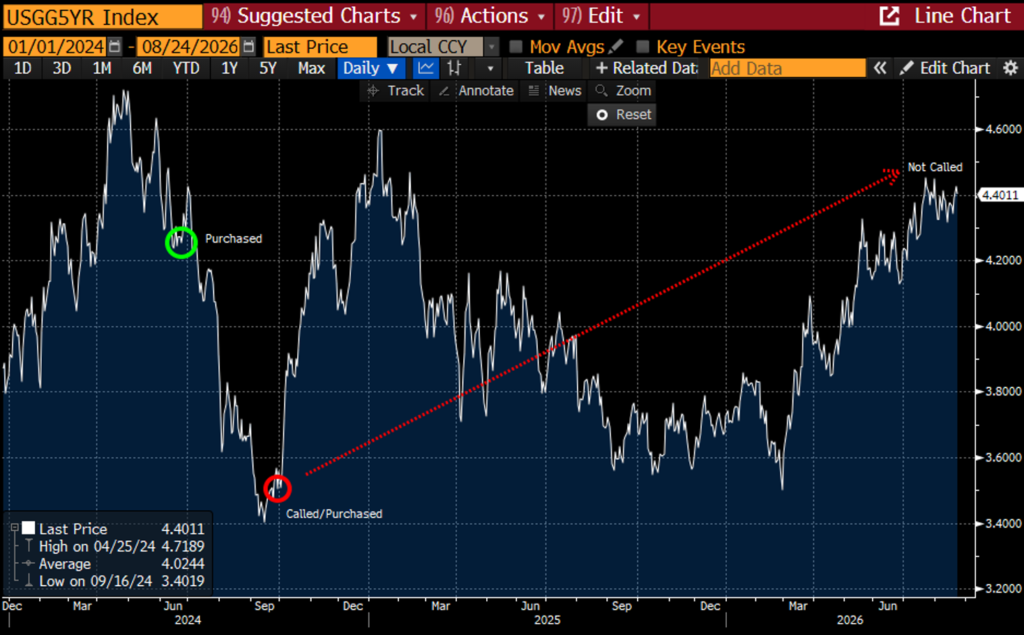
The 5-Year US Treasury yield is currently significantly higher than the rate environment that produced our 4.02% replacement bond…
83 Basis Points. The issuer has ZERO intention of calling that bond. That 4.02% is locked in for now.
For illustrative purposes only | Source: Bloomberg
The scale is important
To be clear, and consistent with what we said about low-coupon MBS in the last article: the mistake is not owning callables, it’s over-reliance on callables.
An appropriate amount of optionality in the portfolio can be managed. Add some callable exposure with the awareness that the coupon might only last as long as the call protection (time to first call date), or look for callables with a little more call protection. These tend to get overlooked because the coupons are considerably lower. However, that coupon will stick around longer if yields fall.
A portfolio that relies predominately on the callable bond could see a massive earnings and structural shift in a relatively short period of time. Credit unions can come to rely on the maturity dates of a callable portfolio as a maturity ladder. When rates fall, the “longer buckets” come rushing in as the calls start to happen. Now we are faced with unexpected, significant liquidity when rates are falling. I have witnessed large asset and small asset credit unions run afoul of overreliance on the new issue callable bond…scrambling to get that money back to work in a less attractive yield environment. We never want to use the word “scrambling” when discussing portfolio strategy.
Wrapping It Up
We have explored three common behaviors and used examples to illustrate the potential impact of each ‘mistake’. Rest assured, all three can and will keep ROA from reaching its potential. Foregone income happens every day/month/year, but you can only find it if you know where to look. That is the purpose of this piece. Not to try to fit your exact situation into one of my examples, but to point out some of the spots where foregone income can fly under the radar.
Consider this… There are many ways to generate income; raise loan rates, lower dividends and/or raise fees. All of these can be viewed negatively by the members. But, earning more through the investment portfolio happens behind the scenes.
Learn what strategies are available that could potentially boost income while providing monthly cash flow.
What Now
We now have three articles cautioning against actions and inactions to be wary of in this current rate environment. Pointing out potential mistakes is just an initial step, but not the whole picture on its own.
Just as relevant a topic is what we should do in this rate environment. How do we invest when yields are relatively high, but uncertainly has led to volatility, and that volatility could easily persist for the rest of 2026.
The next topic will be covered via Webinar and focus on at least one specific strategy. We will discuss how that strategy works and how it can help keep yield volatility out of the portfolio. We will explore how to build a portfolio that generates its own cash flow potentially reducing the need to hold onto excess cash reserves as a contingency for a liquidity event that may not happen again for some time.
If you found your own portfolio anywhere in the last three articles, consider joining us during the Webinar.
Start the Conversation
If you are interested in seeing how active management looks in relation to your credit union’s investment portfolio, submit your information below and a member of our small, 9-person team will contact you to schedule a discovery call and to answer any questions that you may have about the process, or contact Kevin Lynch, Managing Director — Investments, directly at mailto:Kevin.Lynch@opco.com to schedule an introductory discussion.
Request a discovery call: oppenheimer.com/thecreditunionisg/2026-form
Important Disclosures
This report is not intended as a recommendation or an offer or solicitation for the purchase or sale of any security or investment advisory service. The investments discussed in this report may not be suitable for all institutions/investors, who should use the analysis provided by this report as one input into formulating an investment opinion and should consult with their Financial Advisor.
Oppenheimer & Co. Inc. (“Oppenheimer”) does not guarantee that the information in this report is accurate, complete or timely, nor does Oppenheimer make any warranties with regard to the materials or the results obtained from their use.
Nothing in this report constitutes legal, accounting or tax advice. As with any investment having potential tax implications, clients should consult with their own independent tax adviser.
Investments involve numerous risks including market risk, counterparty default risk and liquidity risk. Securities and other financial investments at times may be difficult to value or sell.
The yield and average consider prepayment assumptions that may or may not be met. Changes in payments may significantly affect yield and average life.
Investing in the bond market is subject to certain risks including market, interest-rate, issuer, credit, and inflation risk. Mortgage and asset-backed securities may be sensitive to changes in interest rates, subject to early repayment risk, and their value may fluctuate in response to the market’s perception of issuer creditworthiness; while generally supported by some form of government or private guarantee there is no assurance that private guarantors will meet their obligations. Non-rated bonds or bonds rated below investment grade are speculative in nature and may not be suitable for all investors.
Interest is subject to federal, state, and local taxes. A company’s financial health can change, and when it does, its bonds’ ratings may change as well. So an investment grade bond could become non-investment grade over time and vice versa.
The information is for illustrative purposes only and not a guarantee of future results and Oppenheimer makes no representation or warranty, express or implied, in respect of the securities, services or information mentioned in this report.
Oppenheimer & Co. Inc. Transacts Business on all Principal US Exchanges and is a Member of SIPC 8990398.1
Oppenheimer & Co. Inc. Transacts Business on all Principal US Exchanges and is a Member of SIPC 8990398.1 · CreditUnionGroup@opco.com · 517-333-7769
Webinar: On October 1 the Credit Union Investment Strategy Group of Oppenheimer & Co. Inc. takes up the harder half, live.
Click below to sign up for this must attend webinar!

Sixty minutes on how the phases of the interest rate cycle map to actual portfolio decisions, what each of the Credit Union Investment Strategy Group’s strategic pillars look like applied to a real book, and where the tradeoffs sit at each phase.
This is a working session, not a forecast. Nobody in the room will be told where rates are going.
The goal is to help provide a framework for building a resilient investment portfolio for whichever way the cycle breaks.